Data Preparation with SageMaker Data Wrangler (Part 4)

Enviornment
This notebook is prepared with Amazon SageMaker Studio using Python 3 (Data Science) Kernel and ml.t3.medium instance.
About
This is a detailed guide on using AWS SageMaker Data Wrangler service to prepare data for machine learning models. SageMaker Data Wrangler is a multipurpose tool with which you can * import data from multiple sources * explore data with visualizations * apply transformations * export data for ml training
This guide is divided into five parts * Part 1: Prepare synthetic data and place it on multiple sources * Part 2: Import data from multiple sources using Data Wrangler * Part 3: Explore data with Data Wrangler visualizations * Part 4: Preprocess data using Data Wrangler (You are here) * Part 5: Export data for ML training
Part 4: Preprocess data using Data Wrangler
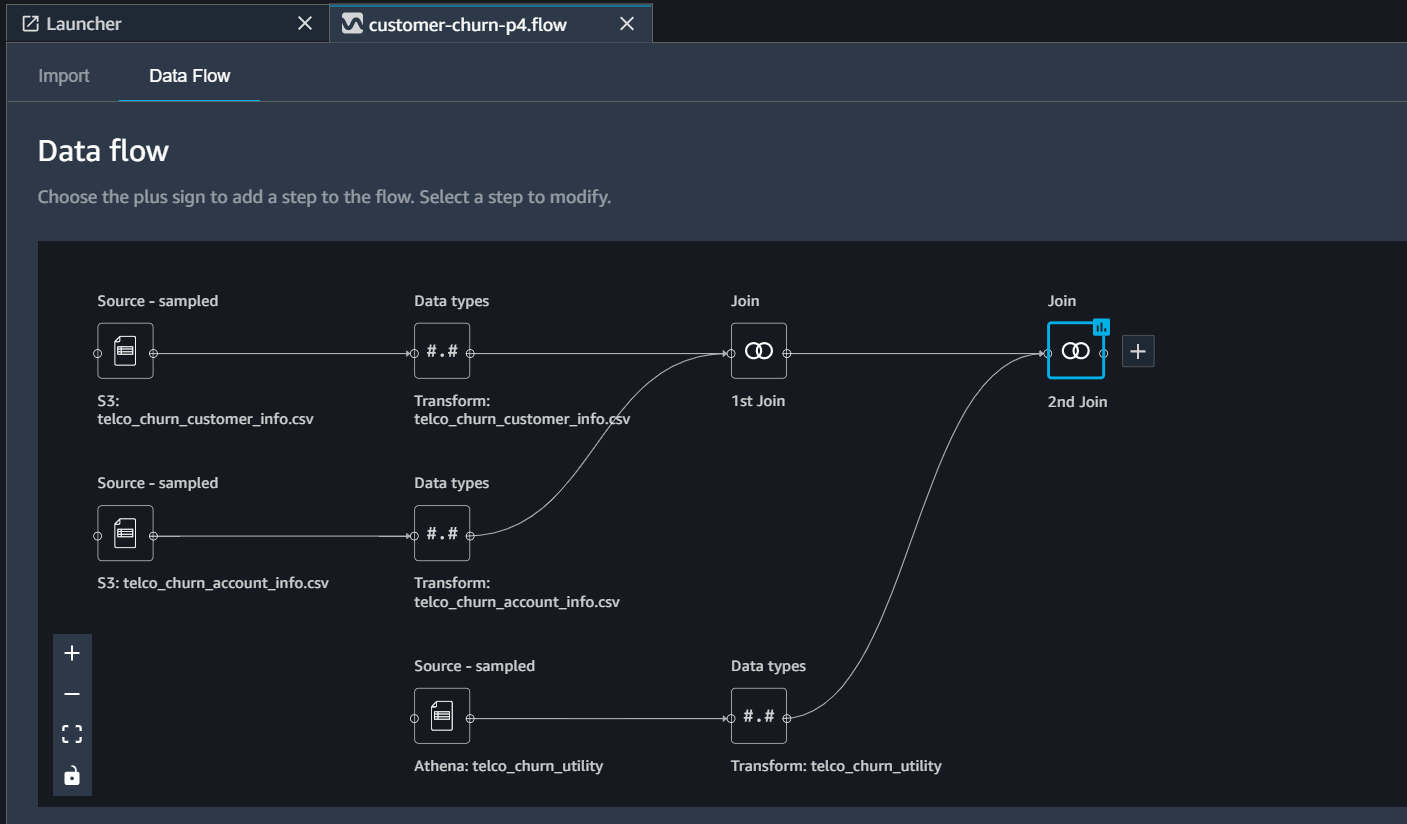
We will continue from where we left in part-3. Open customer-churn.flow file in AWS SageMaker Data Wrangler console. Once opened our flow will look like this
We will add the following transformations to our code.
- Remove redundant columns
- Remove features with low predictive power
- Transform feature values to correct format
- Encode categorical features
- Move the target label to the start
Remove redundant columns
When we made joins between tables (see part-2) it resulted in some redundant columns CustomerID_* . We will remove them first. For this click on plus sign beside 2nd Join, and select Add Transform. From the next transform UI clink Add Step and then search for transformer Manage Column. Inside Manage Columns transformer select
- Transform = Drop Column
- Columns to drop = CustomerID_0, CustomerID_1
Click preview and Add. 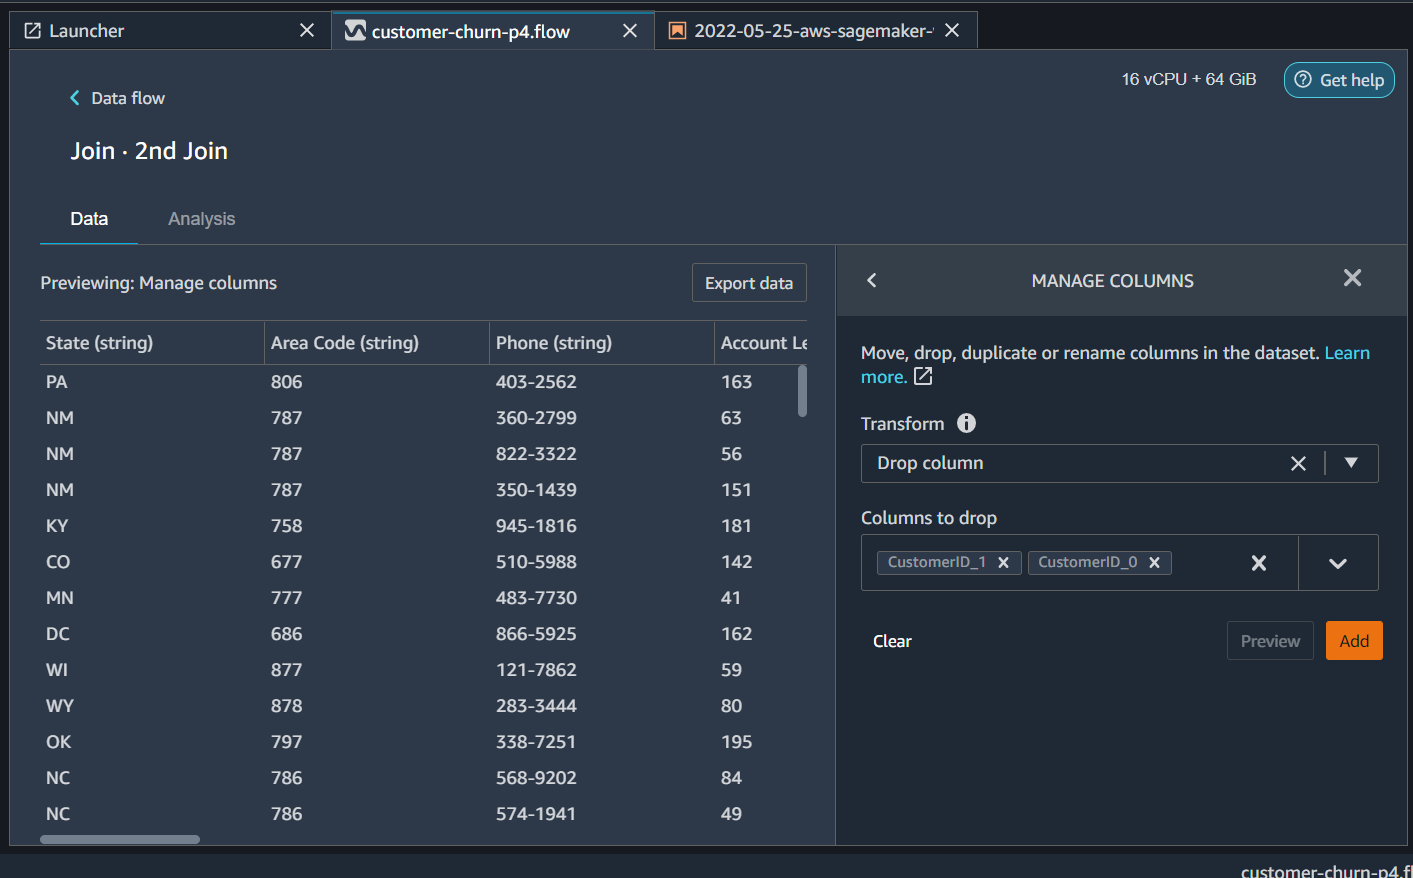
Remove features with low predictive power
In part-3 we used Quick Model to get the predictive power of features. When we analyze features with low importance we find that Phone is one such feature that does not hold much information for the model. For a model, a phone number is just some random collection of numbers and does not hold any meaning. There are other features with low importance too but they still hold some information for the model. So let’s drop Phone. The steps will be same as in the last part.
Transform feature values to correct format
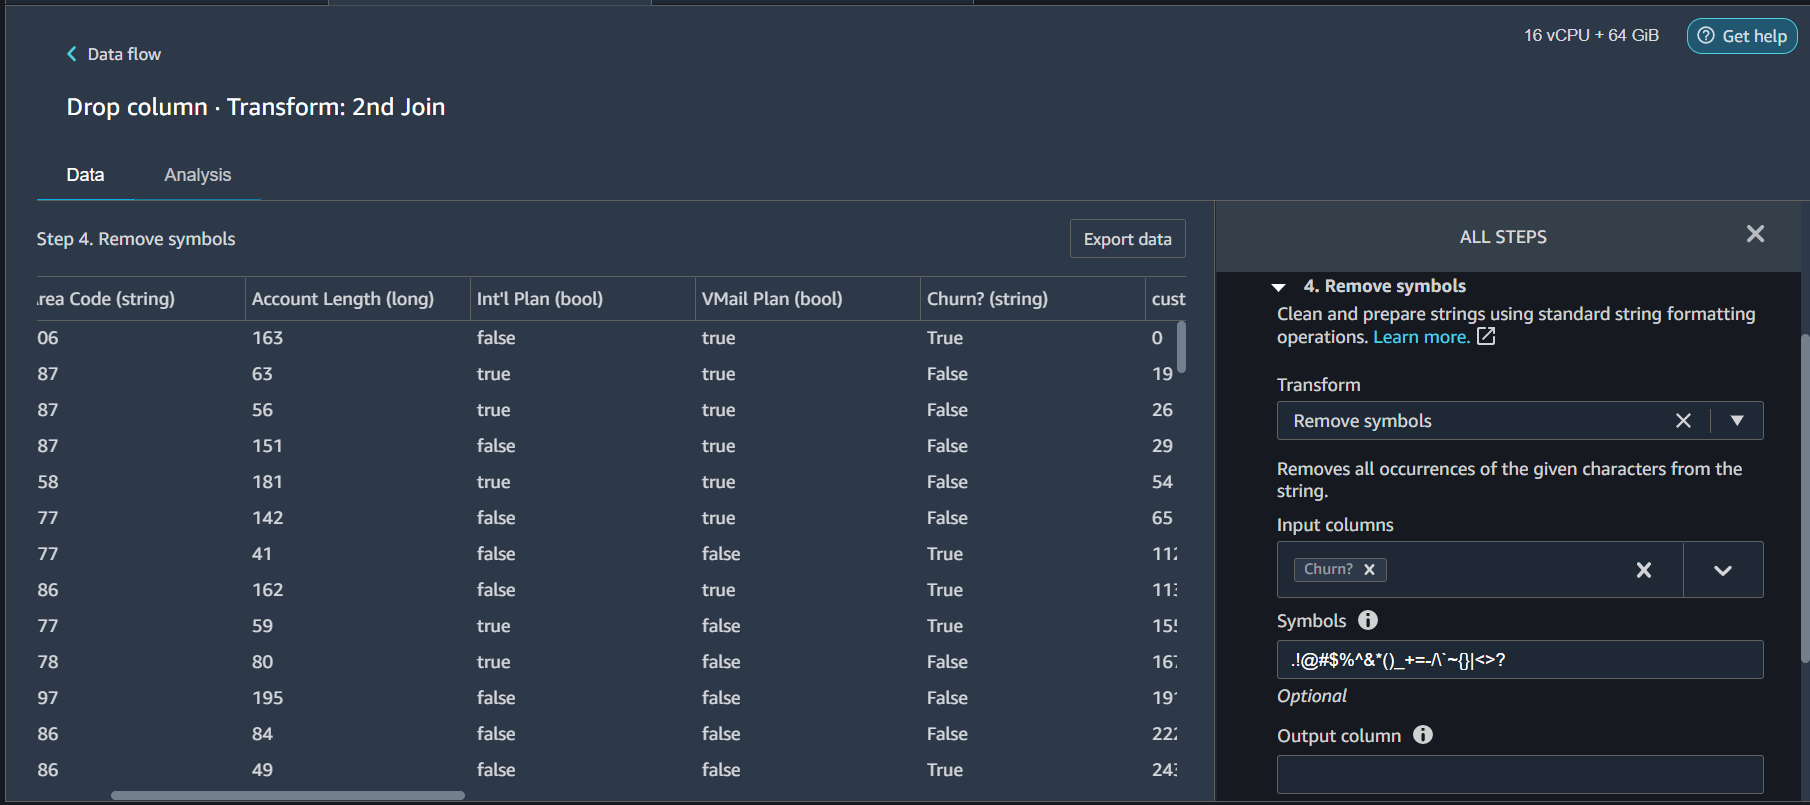
Churn? is our target label but its value has an extra ‘.’ at the end. If we remove that symbol then it can easily be converted to a Boolean type. So let’s do that. From the transformers list this time choose Format String and select
- Transform = Remove Symbols
- Input Columns = Churn?
- Symbols =
.
Click Preview and Add.
Now that the data is in the correct format (True/False) we can apply another transformer on it to convert it to Boolean feature. So select PARSE COLUMN AS TYPE transformer and configure
- Column = Churn?
- From = String
- To = Boolean
Click Preview and then Add.
Encode categorical features
At this point we have only two columns with String datatype: State and Area Code. If we look at the Area Code it has high variance and little feature importance. It is better to drop this feature. So Add another transformer and drop Area Code. For State we will apply one-hot encoding. So for this select transformer Encode Categorical and configure
- Transform = One-hot encode
- Input Columns = State
- Output style = Columns
Leave the rest of the options as default. Click Preview and Add.

Move the target label to the start
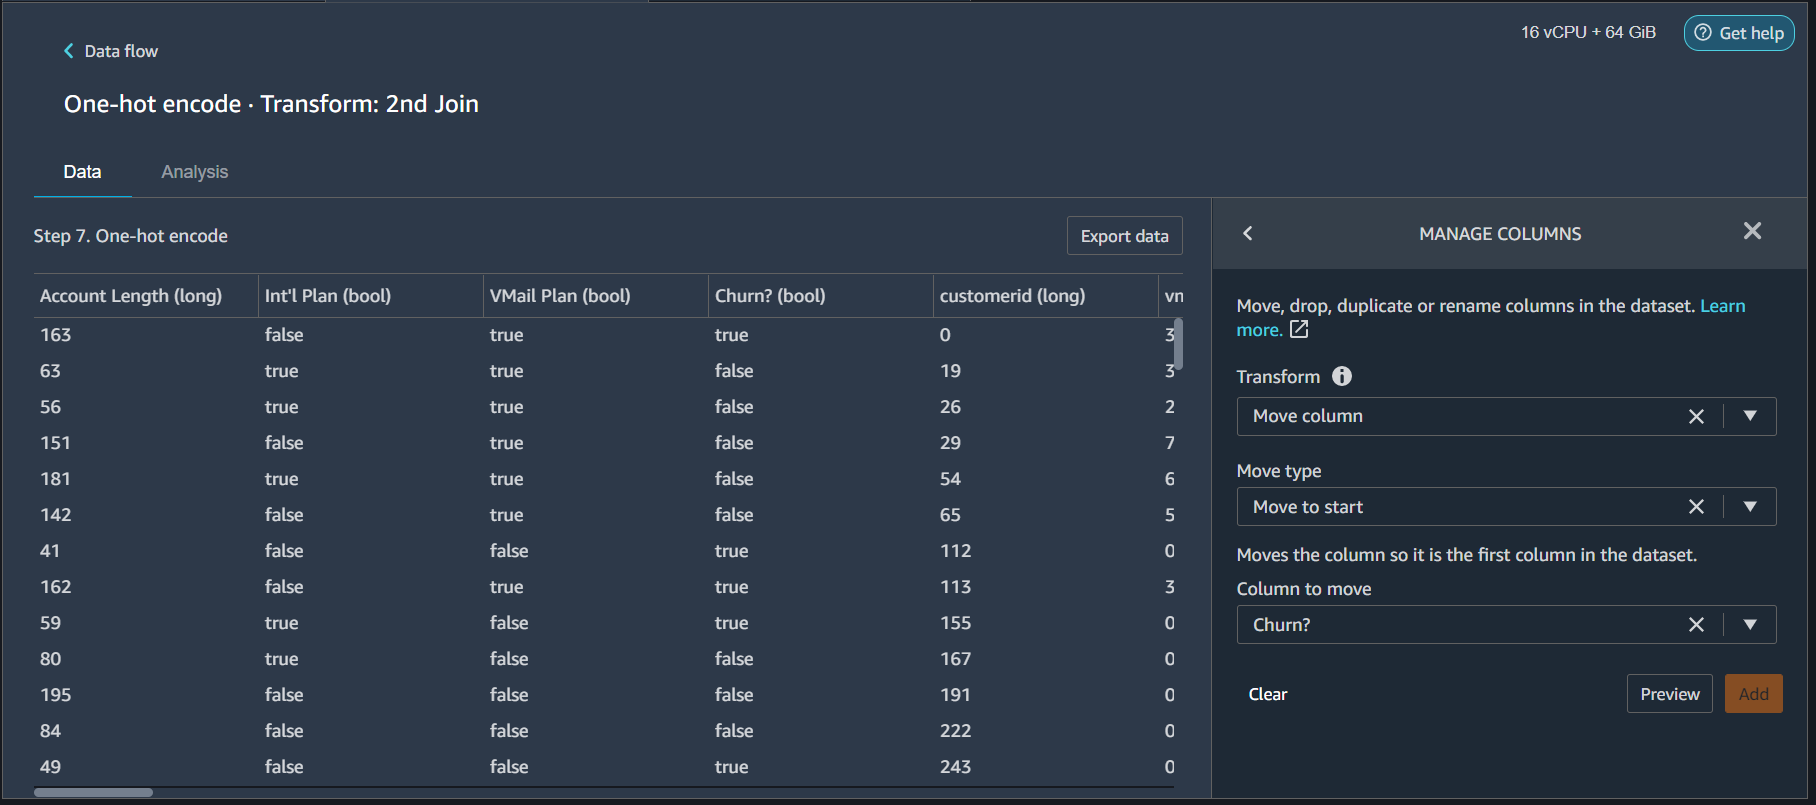
SageMaker requires that the target label should be the first column in the dataset. So add another transformer Manage columns and configure
- Transform = Move column
- Move Type = Move to start
- Column to move = Churn?
Evaluate model performance
We have done some key transformations. We can use Quick Model again to analyze the model performance at this point. We have done a similar analysis in part-3 so let’s do it again and compare the results. From the last transformation step, click plus sign and choose Add Analysis
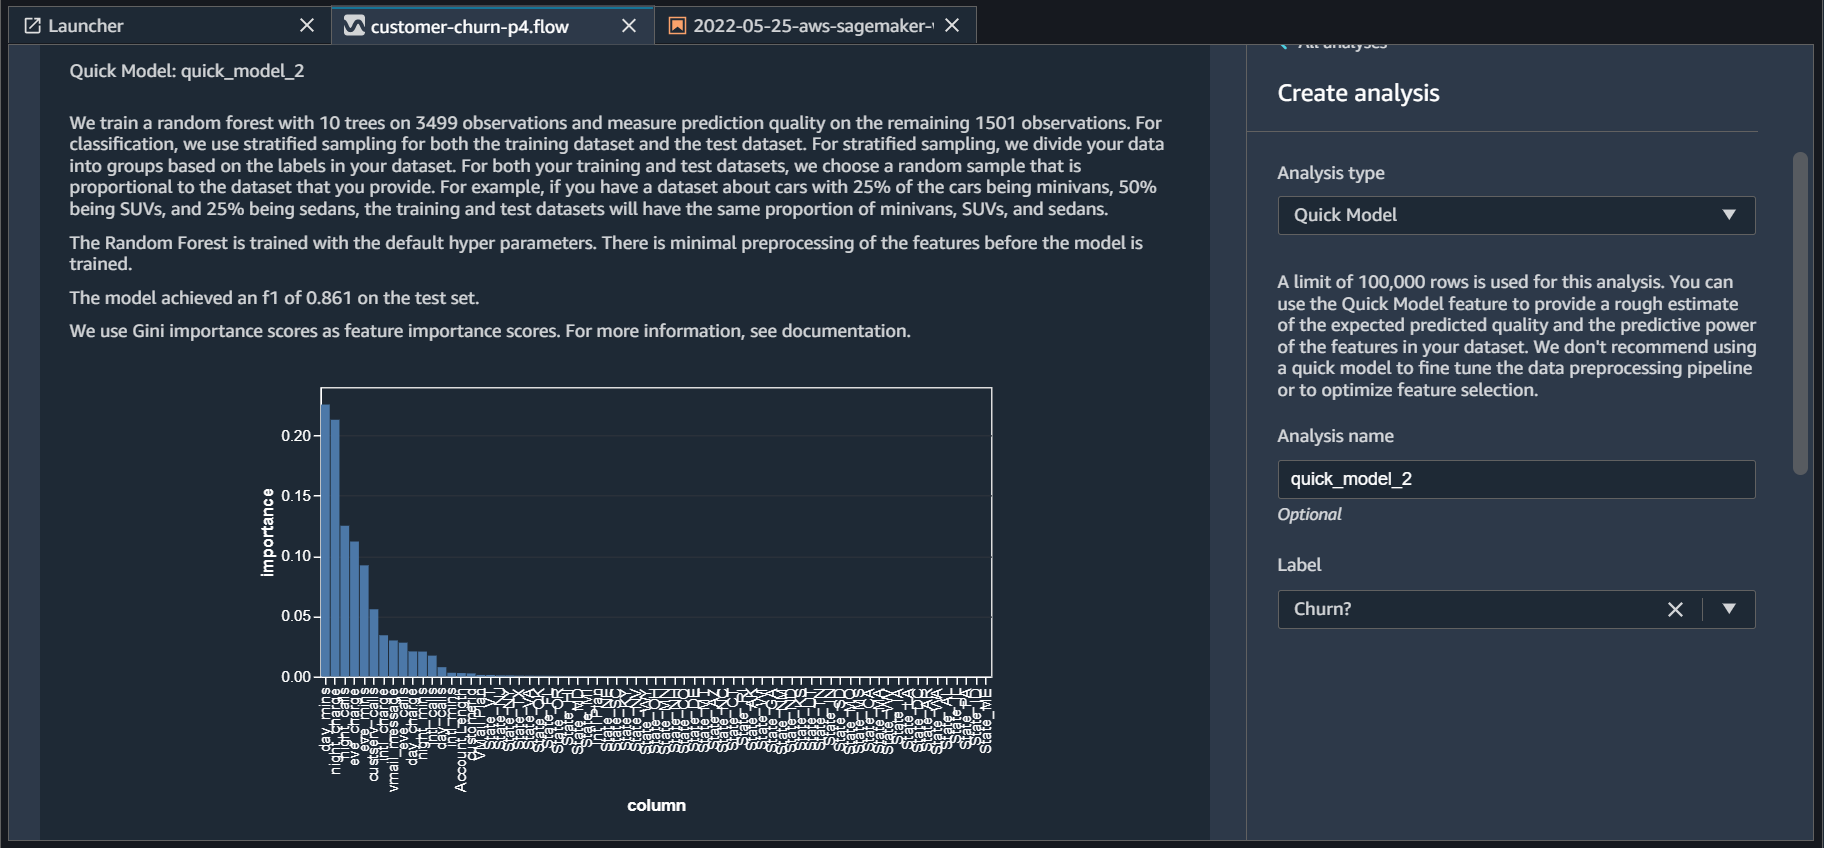
We can see from the results that these transformations have a positive impact on the model performance and the F1 score has moved up from 0.841 to 0.861.
Summary
In this post we have seen how we can apply a transformation to our data and can use Quick Model to quickly analyze the model performance. customer-churn-p4.flow file used in this post can be found on the GitHub here. In the next post, we will discuss how to export data from Data Wrangler to different destinations.