Data Preparation with SageMaker Data Wrangler (Part 3)

Enviornment
This notebook is prepared with Amazon SageMaker Studio using Python 3 (Data Science) Kernel and ml.t3.medium instance.
About
This is a detailed guide on using AWS SageMaker Data Wrangler service to prepare data for machine learning models. SageMaker Data Wrangler is a multipurpose tool with which you can * import data from multiple sources * explore data with visualizations * apply transformations * export data for ml training
This guide is divided into five parts * Part 1: Prepare synthetic data and place it on multiple sources * Part 2: Import data from multiple sources using Data Wrangler * Part 3: Explore data with Data Wrangler visualizations (You are here) * Part 4: Preprocess data using Data Wrangler * Part 5: Export data for ML training
Part 3: Explore data with Data Wrangler visualizations
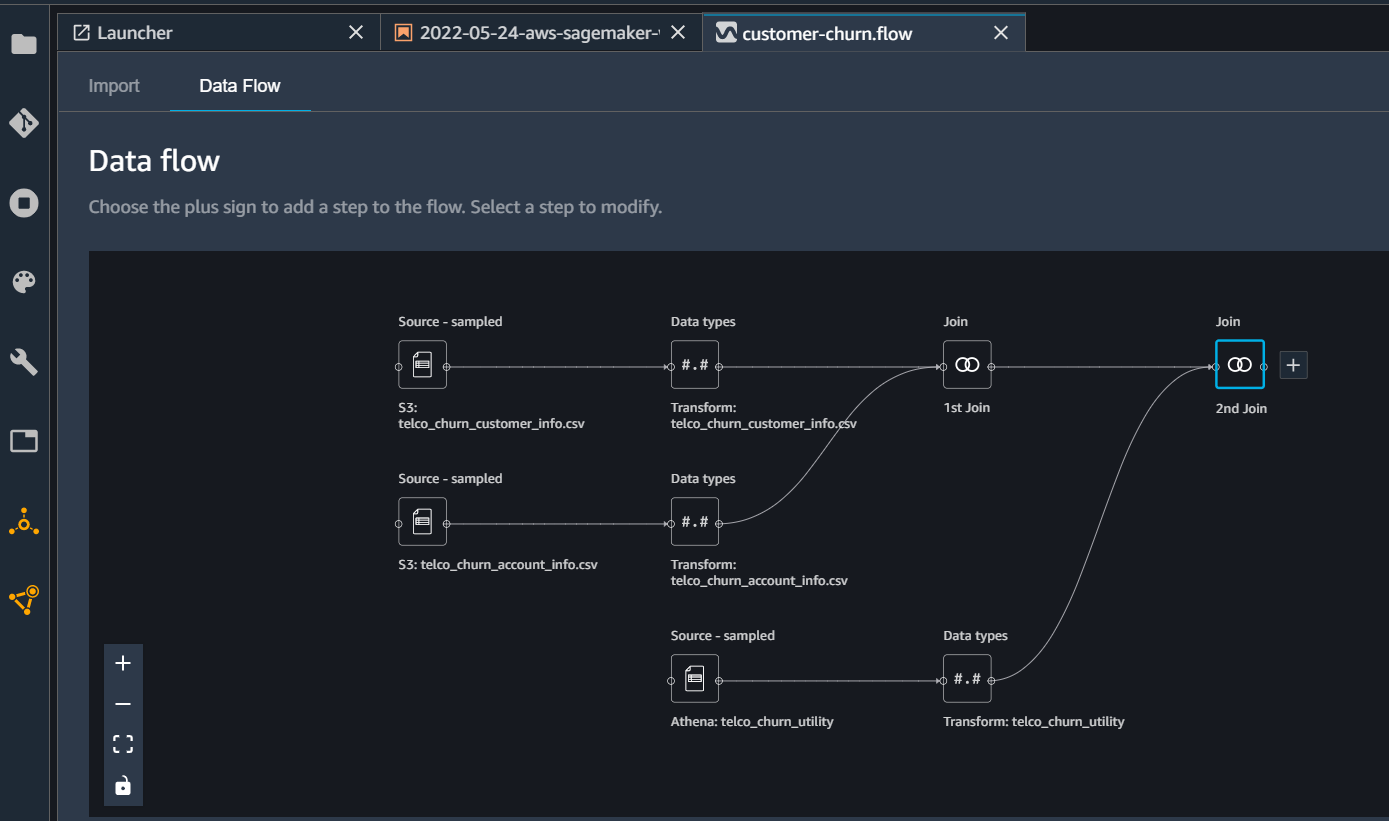
In this post, we will use SageMaker Data Wrangler to create some visualizations for exploratory data analysis (EDA). Open the customer-churn.flow from part-2. It is also available on GitHub here. We will create a histogram to explore the frequency distribution of daily calls. Once the flow process is open on the Data Flow UI it will look like this
Click on the 2nd join plus sign and select ‘Add Analysis’. From the next analysis UI select * Analysis Type = Histogram * Analysis Name = call_minutes_churn * X_axis = day_min * Facet by = Churn?
Click Preview and Data Wrangler will create the following histogram
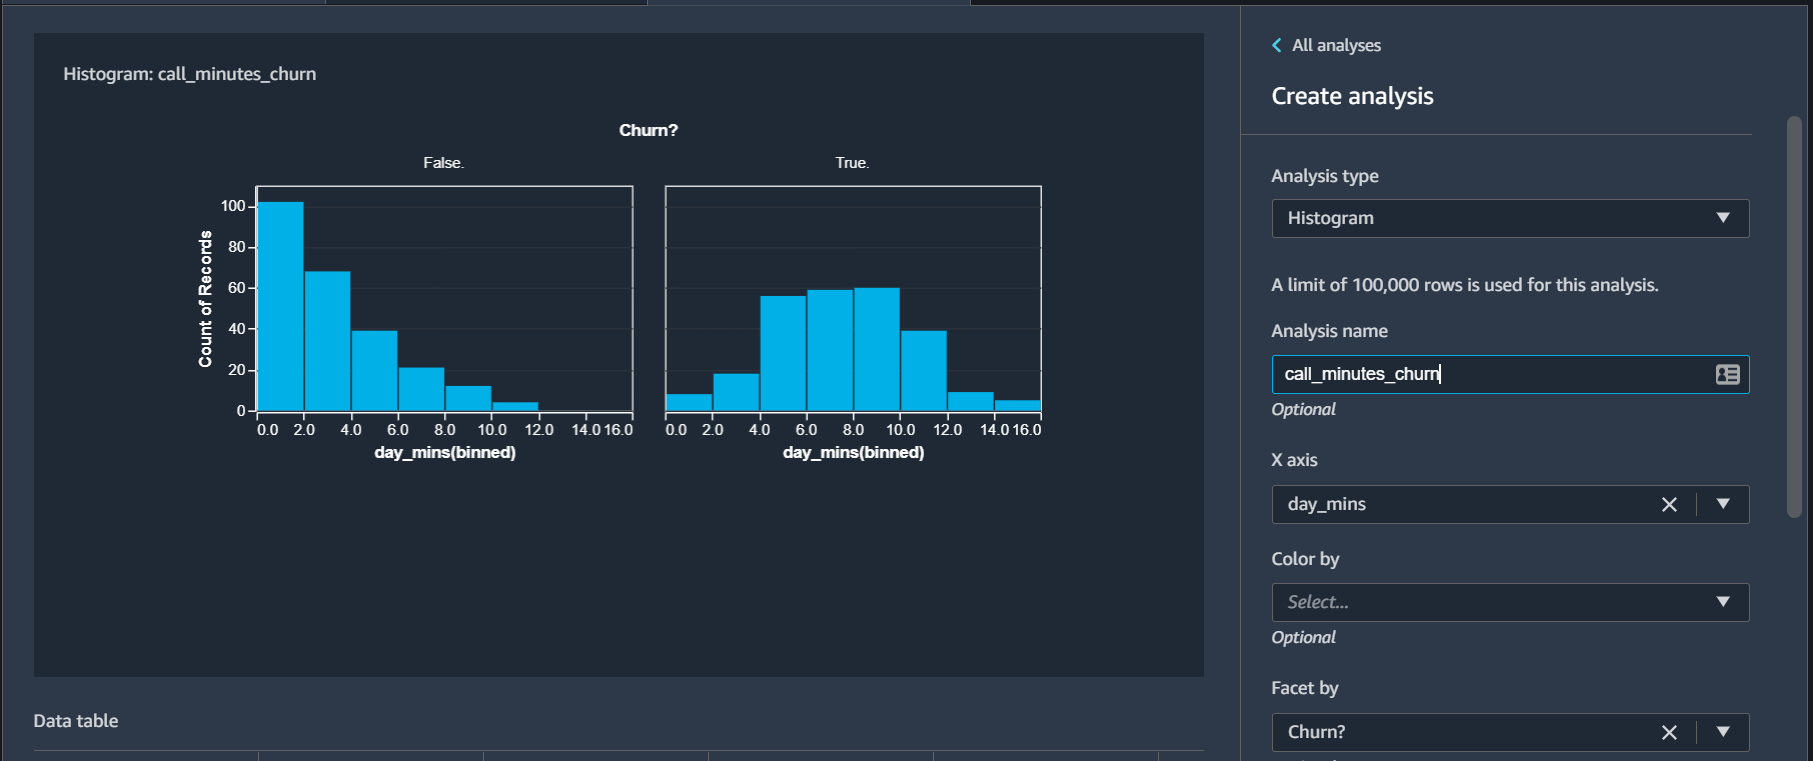
From this histogram you can see that customers whose calls duration are 4 minutes or less are more likely to stay, and customer having call duration longer than 4 minutes are more likely to churn. Save the flow to return back to main Data Flow UI.
Preview ML model performance using Quick Model
Quick Model is another great feature of SageMaker wrangler with which we can quickly train a Random Forrest Classification model and analyze the importance of features. For this again click on the plus sign against the 2nd Join, and select Add Analysis. Then from the Analysis UI select
- Analysis Type = Quick Model
- Analysis Name = Quick model
- Label = Churn?
Label is our target identifier. Click preview. Data Wrangler will take around a minute to train the model, and will provide a chart with feature importances.
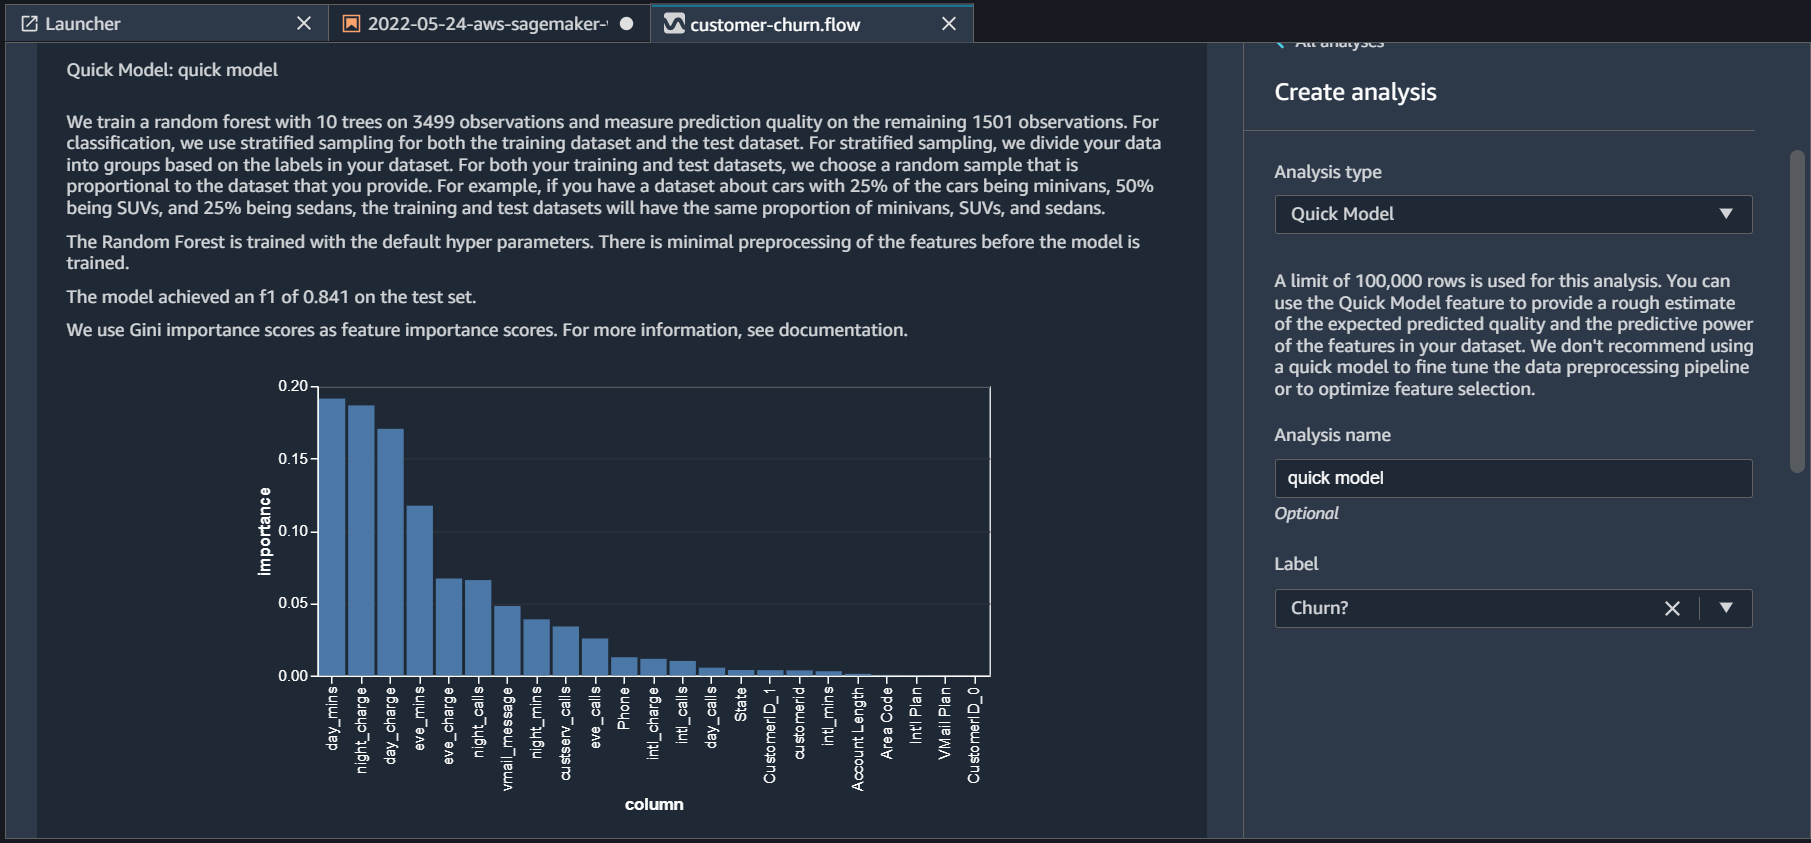
From this feature importance chart, we can see that the day_mins and night_charge features have the highest importance. It also shows that the model has achieved F1 score of 0.841 on the test data. We can take this model as a baseline and work on the important features and model tuning to improve its performance. Click Save to return to the main Data Flow UI.
Summary
In this post, we saw that we can quickly create visualizations from Data Wrangler to do our EDA work. There are many other built-in analysis reports available (check Data Leakage and Data Quality reports) that can quickly provide a very detailed analysis of the data. The customer-churn.flow file is available on GitHub here. In the next post, we will perform some preprocessing and transformations to make our data ready for ML training.